ddebug
ddebug is a python library with a set of tools for simple debugging of python progams. It works only within a python file, not in the console.
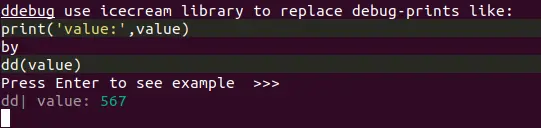
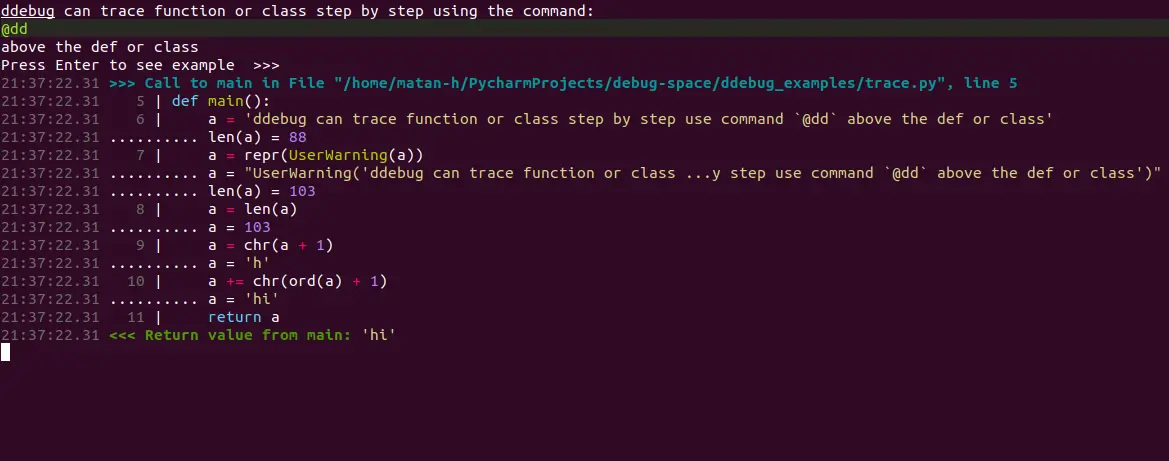
It makes debugging easier with the option to follow a specific variable or function (using snoop library) makes errors easier to see (using rich library) and debug print easier and clearer (using icecream).
Simple Example
from ddebug import dd
@dd  # do @snoop on a function
def foo(n):
    return n + 333
@dd  # do @snoop on all class functions (only possible in ddebug)
class A:
    def bar(self, n):
        return n + 333

dd(A().bar(foo(123)))  # use like icecream.
output:
12:00:00.00 >>> Call to foo in File "python file.py", line 3
12:00:00.00 ...... n = 123
12:00:00.00    3 | def foo(n):
12:00:00.00    4 |     return n + 333
12:00:00.00 <<< Return value from foo: 456
12:00:00.00 >>> Call to A.bar in File "python file.py", line 7
12:00:00.00 .......... self = <__main__.A object at 0x04F64E80>
12:00:00.00 .......... n = 456
12:00:00.00    7 |     def bar(self, n):
12:00:00.00    8 |         return n + 333
12:00:00.00 <<< Return value from A.bar: 789
dd| A().bar(foo(123)): 789
Tracebacks
In ddebug there is an option for more detailed (and more beautiful) traceback than the regular traceback:
from ddebug import dd
#place at start of program
dd.set_excepthook()
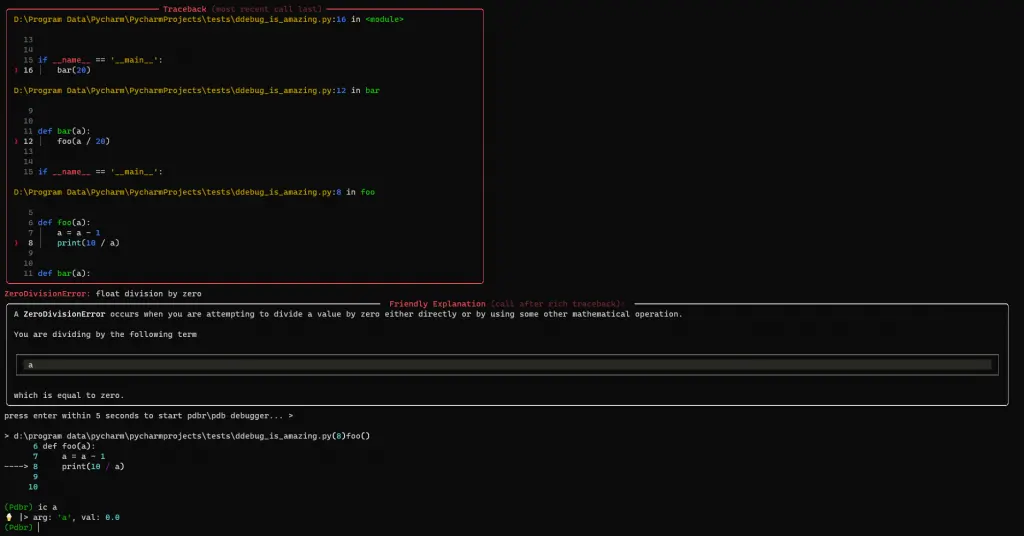
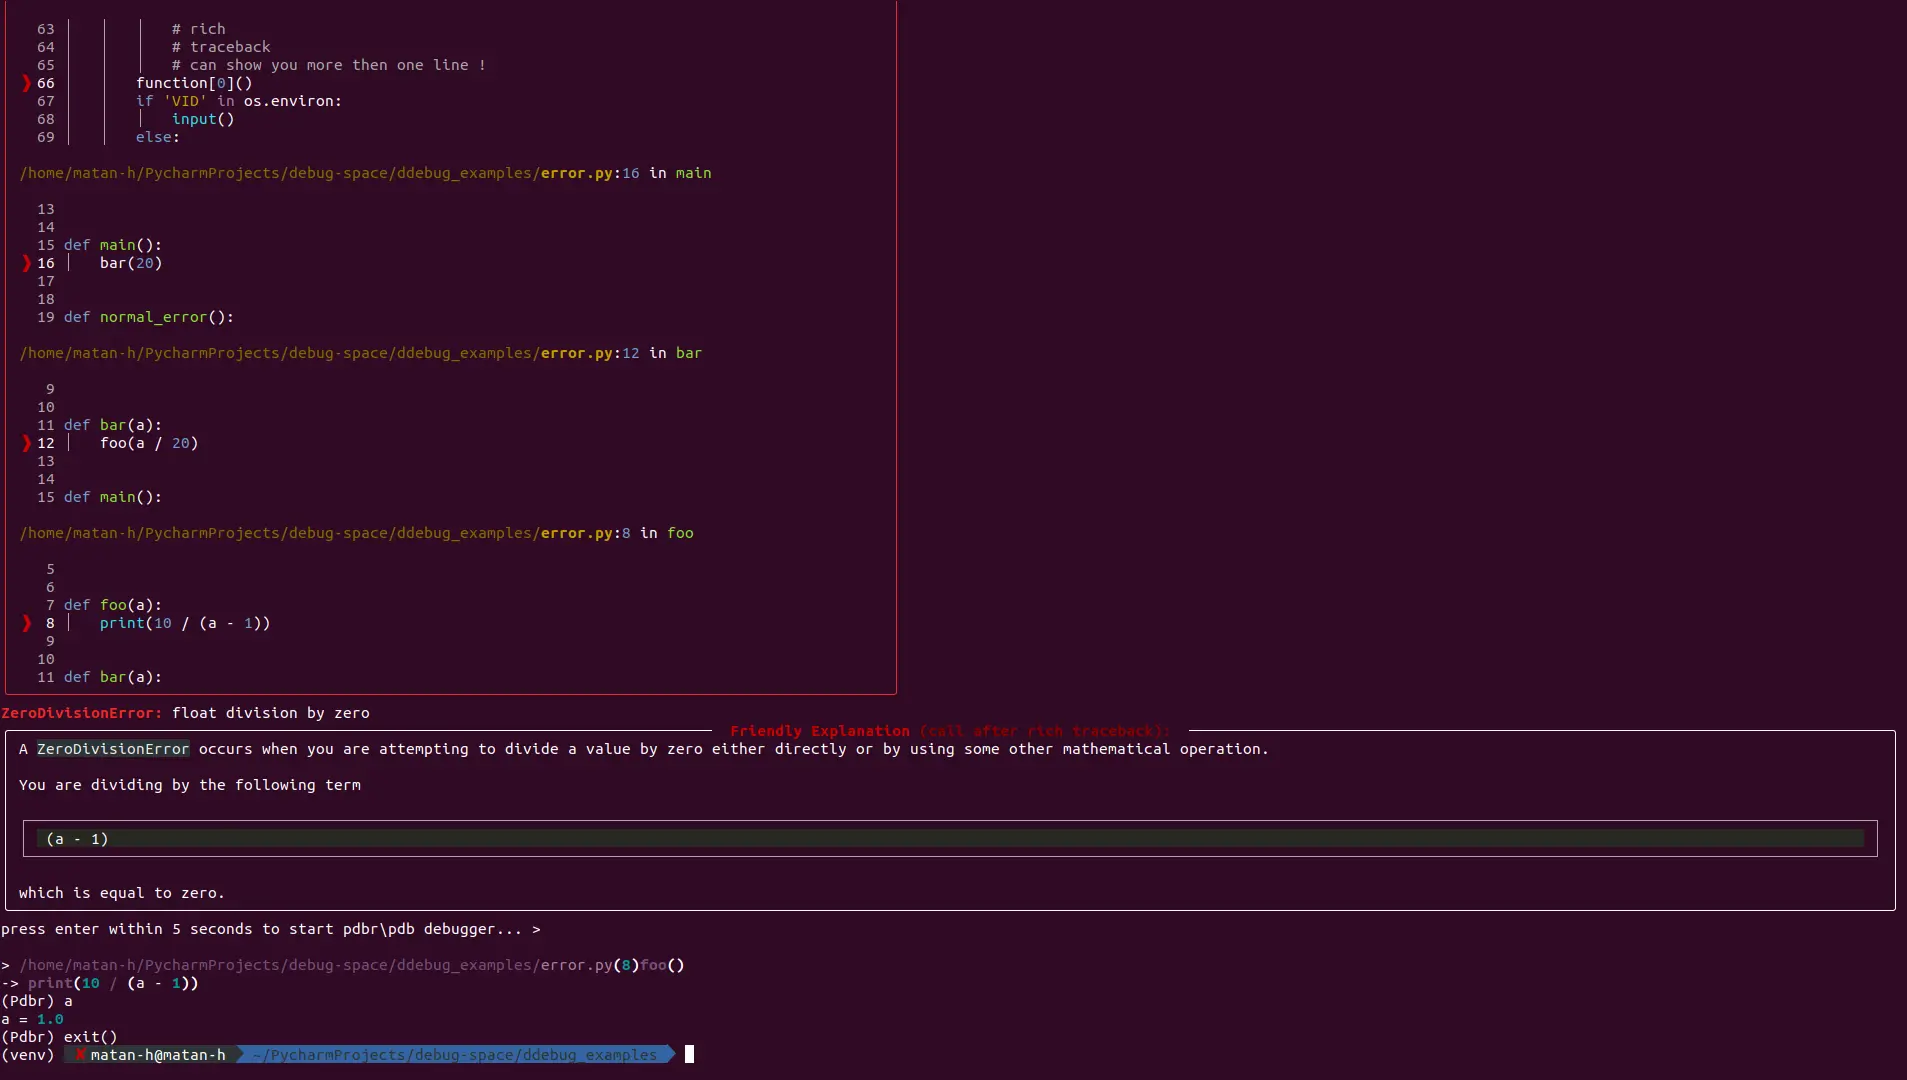
Then when an error occurrs ddebug creates a file named <file>-errors.txt: the file starts with rich (render Python tracebacks with syntax highlighting and formatting) and then friendly explanation of the error.
and ddebug will print all this file in colors.
In addition, you can press Enter within the first 5 seconds after exception and it will open the pdbr debugger. if pdbr has a error, ddebug will start standard pdb:
and the ddebug library has a lot of debugging features:
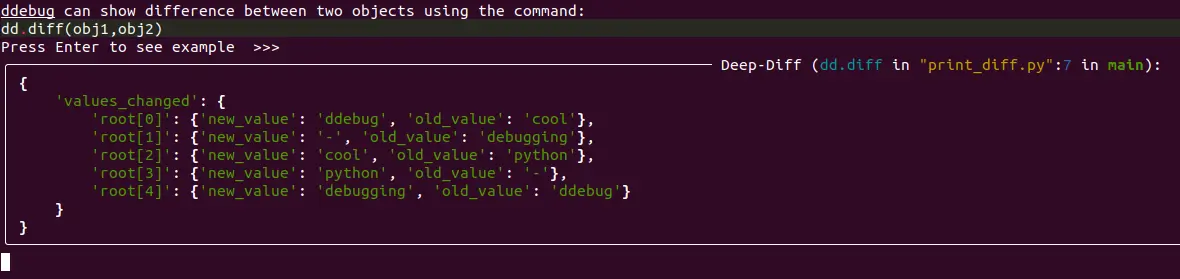
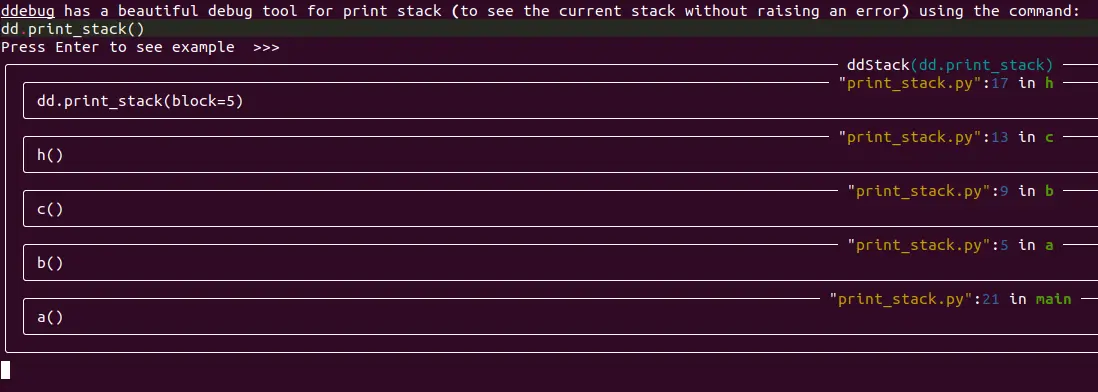
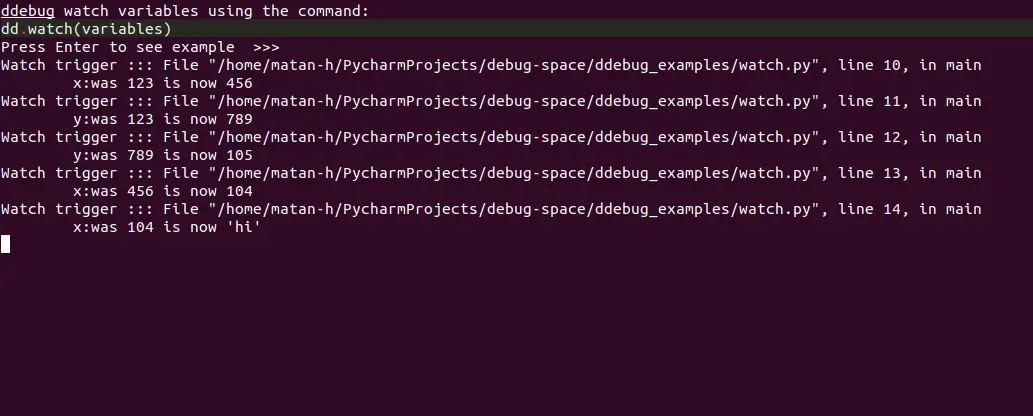
dd.print_stack()– pretty print the python stack:dd.exc ()– auto try –> print ddebug trackbackdd.watch(var)– variable monitor (using watchpoints)dd.diff(obj1,obj2)– ddebug can show difference bitween two objects (using deepdiff )dd.locals– pretty print the locals- ssc,timeit,install,inspect,pprint,deep and more.
here is some screenshots
Comments: (You can also Comment directly to this discussions )